Air pollution in urban neighbourhoods can take many forms, most of them invisible and not evident by smell. We are familiar with the haze that we can see across a cityscape, or occasional smells that indicate one type of source or another, but this is just the tip of the iceberg. Many pollutants in the air can only be detected by sensitive monitoring devices, but are highly important to our health. Poor air quality kills around 7 million people globally each year.
The visible pollution is caused by fine particles that stay suspended in the air for days, and come from a variety of sources. In most cities, emissions from fuel-burning vehicles are the biggest source of fine particles, which are small enough to be breathed into our lungs and cause damage to the respiratory and circulatory systems, even the brain. Heavy industries and fuel-burning power stations are also a source in some cities.
In coastal cities, the particles generated from sea spray during windy conditions at sea can cause haze, as can wildfires that generate huge plumes of smoke that can travel hundreds of kilometres. Microscopic pollens and other natural sources of particles can cause grief to those who are allergic.
Invisible air pollution from multiple sources
Odours and other invisible or gaseous forms of air pollution are equally diverse in where they come from, and also include natural sources. The greatest concern is caused by gases from fuel burning, like nitrogen dioxide, carbon dioxide, and sulfur dioxide. Ozone is a toxic gas created in big cities through a combination of gases from burning, fuel evaporation and vegetation. Yet there are scores of other toxic gases in the air in smaller amounts. Some have an outsized impact on long-term health, like benzene.
An important feature of emissions across a city is how they occur spatially: some, like traffic, are widely spread and unsurprisingly have quite widespread effects on air quality. Some may be localised with smaller overall effects, and others may be localised as emissions but very significant because they are caused by accidental fires or industrial incidents that can have a large impact in neighbourhoods or even wider areas.
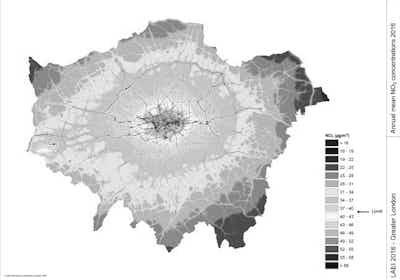
The heat map image above shows Nitrogen Dioxide (NO2) concentrations across Metropolitan London. Sourced from Mayor of London.
While most cities around the world are reporting improving air quality, this does not mean all is fine: the big global death toll due to air pollution attests to that. But what is even more important than simply knowing that pollution is there, surely it is being able to track it down to the source and deal with it as quickly and effectively as possible. This is especially the case for pollution coming from individual sources that don’t emit continuously.
Keeping tabs on air quality in urban areas
This is where Envirosuite’s philosophy comes into play: we believe collecting and displaying data is only the beginning – to be truly worthwhile it must lead to action. That’s why our Smart Cities application does more than just show the data as it is measured across a city - it helps track down problem sources quickly and accurately.
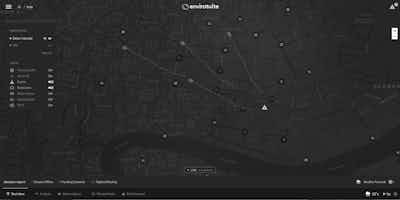
Envirosuite's Smart City application using reverse trajectory modelling to identify the source of an event.
Much depends on what is measured and how often data is received, as well as how many monitors there are. Low cost sensors now permit great numbers of sensors to be deployed, creating lots of data but also creating a problem: how to make sense of all the numbers and get actionable intelligence from it quickly.
While machine learning is a great tool for many problems where large data sets need constant analysis, such as looking for patterns and connections that might be hard to find,. But there are also specialised scientific models and tools that we adapt for use in real time. They give deep insights into where problem pollution or odour is coming from. Using a combination of pollution, meteorological, land use and other data, problem sources of pollution can be tracked down.
Looking at trends on the data over time, as well as the spatial information gained from our analytics, is a powerful combination that goes well beyond the relatively simple, yet impressive looking, displays of data that are now widely available.
Improving air quality with predictive technologies
Envirosuite´s cloud platform provides deep insights into air quality events using three dimensional atmospheric dispersion models to provide an early warning system for air pollution.